Copyright (c) Hyperion Entertainment and contributors.
Using Crash-Logs for Debugging
Introduction
Bugs in software are a fact of life. It is almost impossible to write software with zero bugs. To date, no-one has come up with a method of even proving that a computer program is bug-free. Given these facts, it would be desirable to obtain as much information as possible about any crash that occurs. This is essential for debugging purposes.
AmigaOS provides substantial information via the Grim-Reaper. The Grim-Reaper pops up whenever a program performs an illegal operation, and provides a whole host of information about the crash. Details that are listed include the name of the program/library in which the crash occurred is listed along with the state of the CPU, a stack trace, and other state information. This information could be used in order to isolate the specific line of code at which the program crashed. However, this requires suitable preparation.

It is possible to embed debug information into a binary. However, this is undesirable in software being released to consumers as the binaries are inflated to several times the original size (tens of megabytes in size is easily obtainable in this manner). From the customers perspective, this is completely wasted space. Also, it gives a wealth of information about the internals of your program, which is undesirable. As will be shown below, there is a methodt hat can be used to provide compact binaries to end-users whilst still being able to use their crash-logs in order to locate and fix bugs.
Enabling Debugging
It is very easy to enable debugging in GCC. Simply add the compiler flag "-gstabs" when compiling and linking. This tells GCC that you wish to include debugging symbols in the binary, and even works if optimizations are enabled. "Stabs" is a particular format in which the debugging symbol; "-ggdb" is another option that also adds debugging symbols, but in a different format. However, I have been told that there are issues with "-ggdb" and large applications, so it is best to stick to "-gstabs."
Debug Binaries
As was mentioned previously, enabling debug symbols inflates the binray size significantly. What many people do not realize is that it is possible to create a separate file that contains all the debug information; here is an excerpt from the make-file that achieves this:
$(TARGET): $(OBJS)
    $(CC) $(CFLAGS) -o $@.debug $(OBJS) $(LIBS) $(LINK)
    $(STRIP) $@.debug -o $@
Where CFLAGS = -mcrt=newlib $(OPTIMIZE) -Wall -gstabs
In the File:Usingcrashlogs.lha this translates to:
gcc -mcrt=newlib -O3 -Wall -gstabs -c -o badboy.o badboy.c
gcc -mcrt=newlib -O3 -Wall -gstabs -o badboy.debug badboy.o
strip badboy.debug badboy
The first line compiles the single source-file, badboy.c. The next one links it, and creates an executable called badboy.debug, which contains all the debugging symbols. Finally, strip removes all the debugging symbols and creates a binary called badboy. This stripped binary can then be distributed to end-users; badboy.debug is kept by the developer for interpreting crash-logs.
Interpreting Crash-Logs
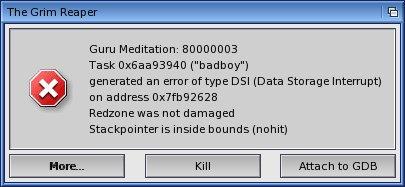
This is best understood by example. Download and extract the File:Usingcrashlogs.lha. Open a shell window and change to the directory containing the template code. Type make, and press enter. This will compile a program called badboy that deliberately performs an illegal operation. It performs a classical NULL-pointer dereferencing for a write operation; a very common bug. Now run badboy; the grim-reaper should pop up and display the error message below.

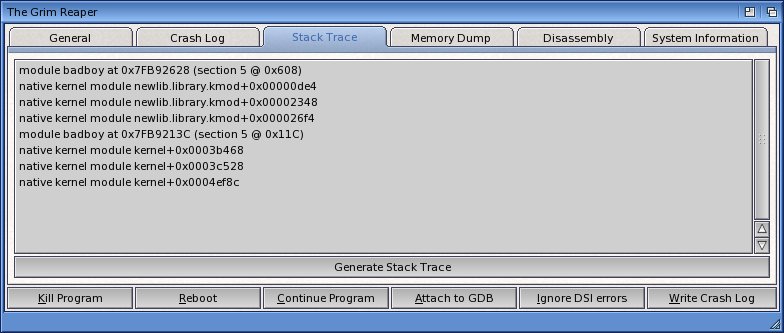
Now click on "More..." and select the "Stack Trace" tab. Clicking on the "Generate Stack Trace" button will generate a stack trace.

This shows that the crash occurred within "badboy" in section 5 at 0x608. Open a new shell window and change to the directory containing "badboy" once again. Enter the following line:
addr2line -e badboy.debug --section=.text 0x608
This performs a lookup of 0x608 inside "badboy.debug," which contains the debug symbols. Addr2line will respond by giving the file and line number of this address.

Line 25 performs a write to address zero:
int *a = NULL;
*a = 0;
The procedure above has identified the exact source-line at which the crash occurred. In this case the crash was deliberate in order to present an easy to understand example. However, in a real application, the*.debug version of each release would be kept by the developer so that crash-logs submitted by users can be used in order to identify the source-line at which the crash occurred. If you look at the MiniGL templates that I have written, you will notice that all of them use this technique.
Download
Using crash-logs template and example
Wish-List
Whilst the technique above works, a more automated bug tracking system would be nice. The first component of such a system would be an automated crash-log submission system. If Grim Reaper provided a singl-click method of submitting a bug report to the developer via the internet, more crash-logs are likely to be submitted. Having a tool that would parse the crash-log and automatically find file names and line numbers for the entry in the crash-log would also be useful.
Author
Copyright (c) 2008 Hans de Ruiter.
Reproduced with permission.
See the original article here.